Infographics are a topic I’ve always wanted to cover on Adobe Live, and this ocean illustration was something I started back around 2019. I had an opportunity to do both when Adobe Live reached out about an in studio event in San Francisco again working in Adobe Illustrator and Adobe InDesign covering more advanced topics. I also got to hang out with two other incredibly talented designers, Elisha Zepeda and Tyler Pate and coincidentally we all were sort of working on projects for print which was cool.
Final Design
When I had originally created the background art I was going for a super detailed almost painterly look in Adobe Illustrator, but I didn’t like the way that style applied to the foreground elements, it sort of took away from the information being presented. Infographics can be really tricky to layout, there’s a lot of complex information being presented in a highly visual way all competing for the user’s attention. It’s important to have good hierarchy, and contrast, not only in the size and placement of elements, but also in the level of detail to draw attention to the story you’re trying to tell.
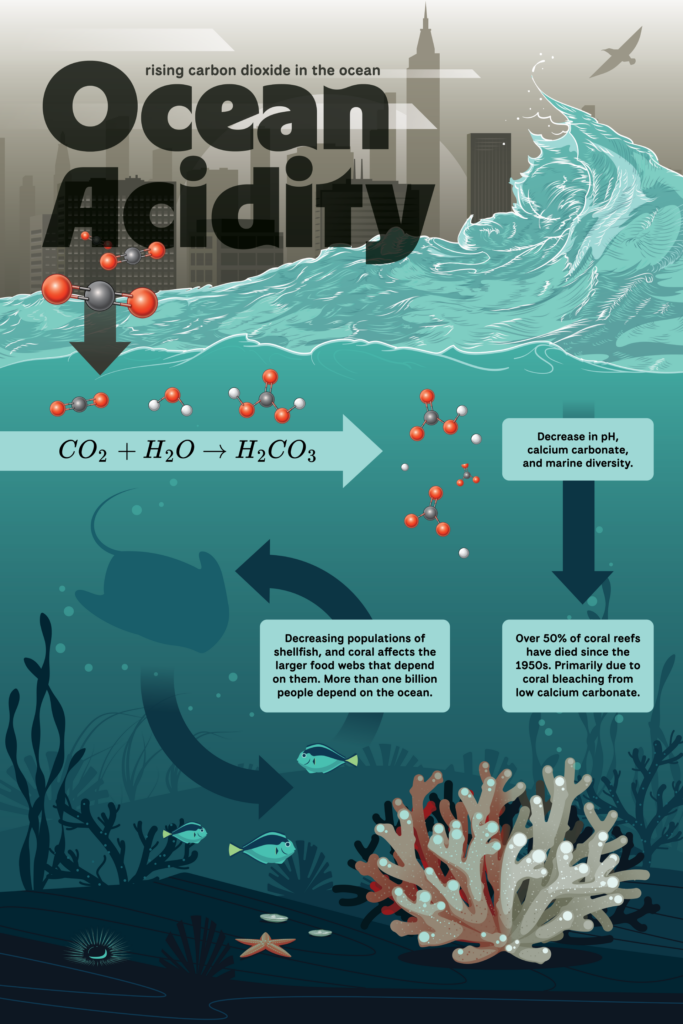
The illustrations were all created in Adobe Illustrator and put into a Library to pull into InDesign. Then the layout, text, arrows, and math content was added in InDesign. The chemical equations use Math Expressions in InDesign which is a really handy way to create mathML. It’s not particularly easy or straightforward to find fonts that support special math and Greek characters, and mathML solves that need allowing not only for special characters but the correct layout, for things like fractions, super, and subscripts. The composition is meant to lead your eye from the initial topic, through the process, and then the effects.
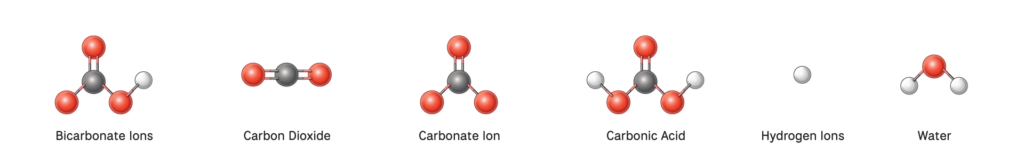
Illustrations
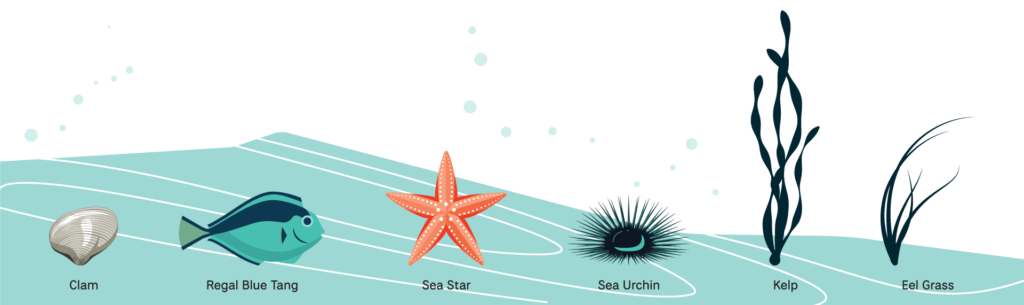
The supporting illustrations help tell the story, all of the chemical breakdowns of carbon dioxide and water that occur during the process, as well as some of the most impacted animals. I also included illustrations of sea kelp and eel grass, to talk about the positive effects those can have to balance out all of the negativity.
Color Palette

Social Media
In the second part of the live stream, I switched to focus on Adobe Express. Again, because I had a library of assets, I was able to quickly remix them and come up with an on brand animation. I’ve worked with past clients that have reused individual statistics, sometimes adding a few more facts, to create content for social media. I also think there’s value in presenting key statistics this way to really emphasize their significance. I could see this as being a great way to advertise for an exhibit if maybe this poster was a part of a museum exhibit.
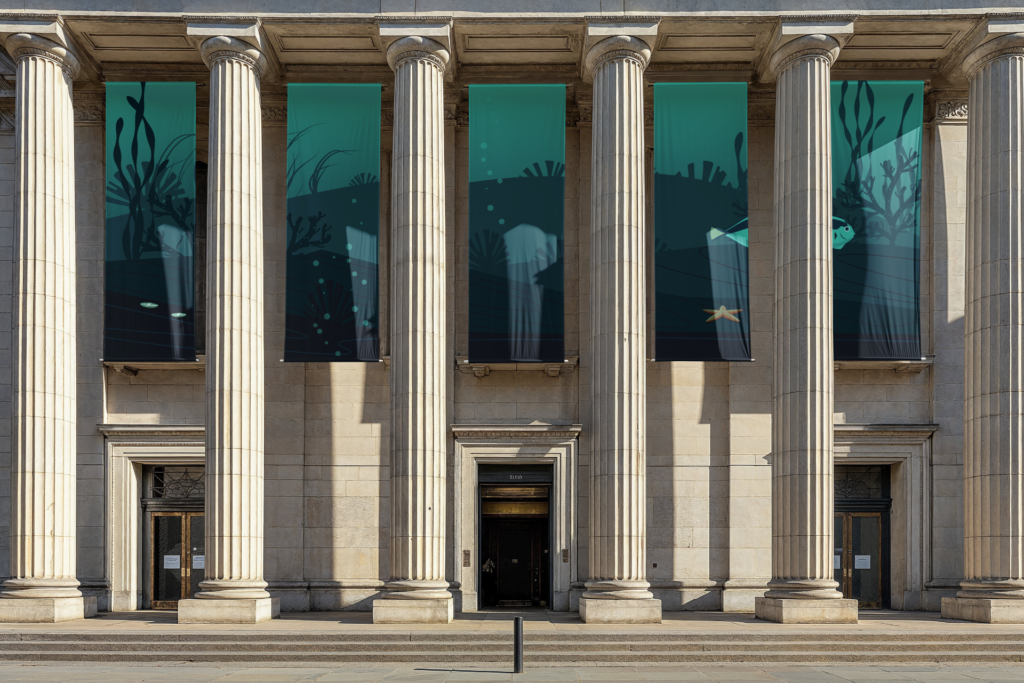
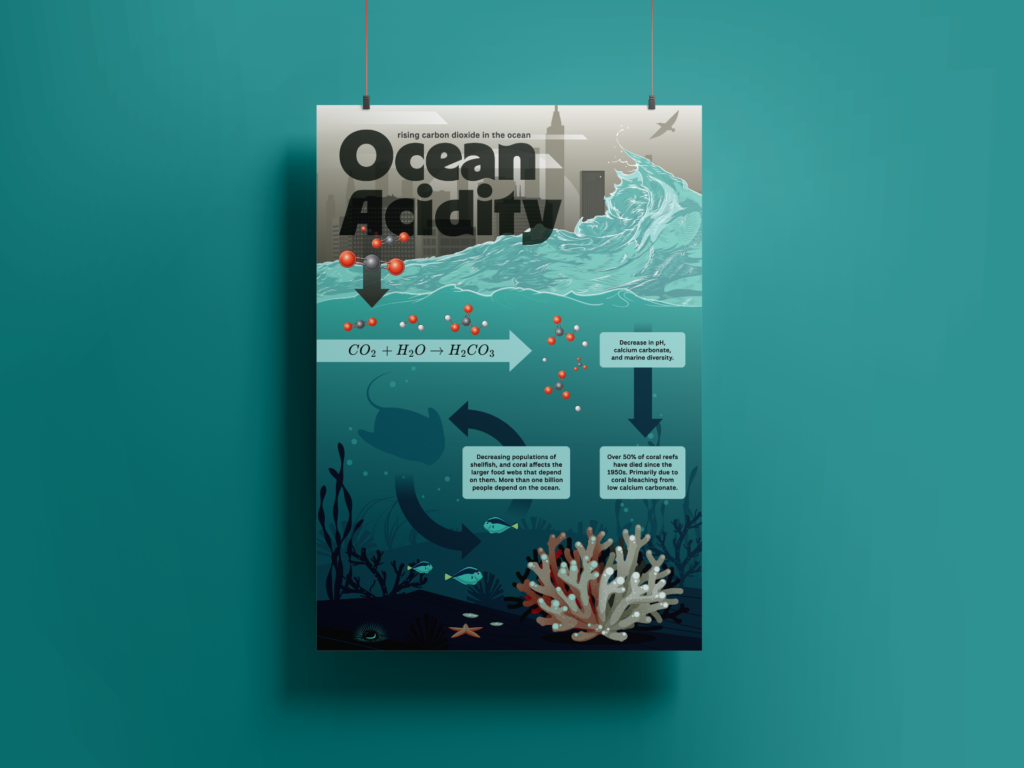
Mock-ups
I liked the idea of a museum exhibit on this topic that after the Adobe Live event, I put together some mock-ups showing how the graphics could be used in that context.